
Introduction
You've spent 30 years building wealth. Now comes the harder question: how do you spend it without running out?
This tension sits at the heart of retirement planning. Withdraw too freely and you risk depleting your corpus in your 70s. Withdraw too conservatively and you spend your retirement years unnecessarily anxious about money you actually have.
The Safe Withdrawal Rate (SWR) is the framework designed to resolve this tension. It's the percentage of your retirement corpus you can withdraw in Year 1, increase annually by inflation, and still have a high statistical probability of not outliving your money. Most models target 90% or better.
For Indian retirees, applying this framework isn't straightforward. The most cited benchmark, the 4% rule, was built on US market data, US inflation assumptions, and a US tax structure. None of those translate cleanly to India. What works for a retiree in California often fails one in Chennai — and knowing why is the first step to getting your own number right.
Key Takeaways
- 3%–4% of corpus is the standard Year 1 withdrawal range — adjusted for inflation annually, and a starting point, not a fixed rule.
- At 6.64% average CPI inflation (2004–2024), India's inflation environment makes the US-derived 4% rule unreliable for Indian retirees.
- Research specific to India suggests a sustainable rate of 3.0% for average investors — lower than the Western benchmark.
- A guardrails-based withdrawal strategy can support a higher initial rate than a rigid fixed-withdrawal plan.
- Other income sources (EPF, NPS, SCSS, rental income) reduce your required portfolio withdrawal, effectively extending corpus longevity.
What Is the Safe Withdrawal Rate?
The Core Definition
The Safe Withdrawal Rate is the annual percentage of your total retirement portfolio you withdraw in Year 1, then increase by inflation each year, while maintaining a high probability — typically 90%+ — that your corpus won't be exhausted over your retirement horizon.
The formula is straightforward:
SWR = Annual Withdrawal Amount ÷ Total Retirement Corpus
Take a ₹2 crore corpus. At a 4% SWR, your Year 1 withdrawal is ₹8 lakh. With 6% inflation, the rupee amount compounds each year as shown below — the question is whether the portfolio can sustain that growing withdrawal over 25–30 years.
| Year | Withdrawal Amount |
|---|---|
| Year 1 | ₹8.00 lakh |
| Year 2 | ₹8.48 lakh |
| Year 3 | ₹8.99 lakh |
What SWR Is Not
Three clarifications:
- Not a guarantee. A 90% confidence level means the portfolio survived in 9 out of 10 historical simulations. One in ten scenarios still ends in depletion.
- Not a one-time calculation. Markets change, inflation changes, your spending changes. The SWR you start with at 60 should be revisited at 65, 70, and beyond.
- Not a universal number. Your retirement horizon, asset mix, other income sources, and tax situation all affect what rate is safe for you.
The 4% Rule: How It Works and Where It Came From
Origin and Mechanics
Financial planner William Bengen developed the 4% rule in 1994 using US historical market data. His analysis, published in the Journal of Financial Planning, tested a portfolio of 50% stocks and 50% intermediate-term Treasury bonds across every 30-year retirement period in US history — including the worst sequences. The conclusion: a 4.15% initial withdrawal rate survived all historical scenarios. The mechanics are straightforward. Withdraw 4% of your total portfolio in Year 1, then increase that rupee amount by inflation each year, irrespective of market conditions.
Worked example:
- Corpus: ₹3 crore
- Year 1 withdrawal: ₹12 lakh (4%)
- Inflation: 6%
- Year 2 withdrawal: ₹12.72 lakh
- Year 3 withdrawal: ₹13.48 lakh
The portfolio must generate enough growth to absorb these rising withdrawals for 30+ years.
What "Confidence Level" Means
SWR research runs thousands of market simulations across different scenarios. A 90% confidence level means the portfolio survived intact in 9 out of 10 historical sequences. Targeting 95% means withdrawing less. Accepting 85% means you can spend slightly more — but take on greater depletion risk.
Updated Research Figures
Recent data reinforces why the confidence level you target shapes the withdrawal rate you can sustain. Morningstar's 2025 retirement income analysis revised the safe starting withdrawal rate down to 3.7% for a 30-year horizon at 90% confidence, citing higher equity valuations and lower projected forward returns. That's below the original 4% benchmark — and it applies to the US market, where inflation has historically run lower than India's structural 5–7% range. Indian retirees working from these numbers should treat them as a reference framework, not a direct prescription.
Horizon Matters
| Retirement Horizon | Approximate SWR Range |
|---|---|
| 20 years | 4.5%–5.0% |
| 25 years | 4.0%–4.5% |
| 30 years | 3.7%–4.0% |
| 35+ years | 3.0%–3.5% |
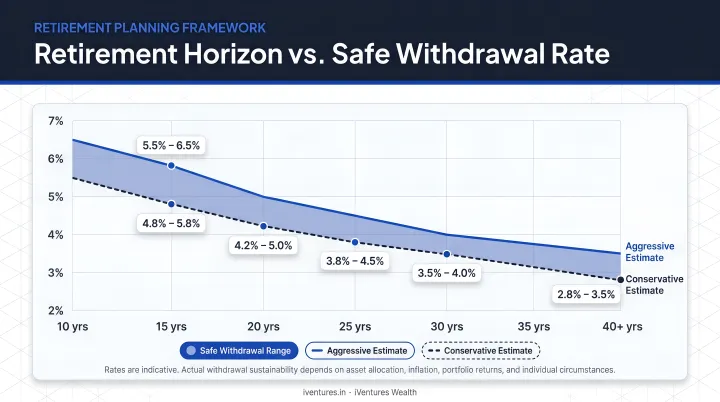
A retiree at 58 planning for 35+ years faces a fundamentally different withdrawal calculus than someone retiring at 70 with a 20-year horizon.
Key Factors That Determine Your Safe Withdrawal Rate
Retirement Horizon and Indian Longevity
According to India's Sample Registration System (SRS) 2018–22, life expectancy at age 60 is 18.1 additional years on average — meaning age 78. But averages are misleading for planning purposes. You're not planning for the average; you're planning against running out of money if you live longer.
World Bank data shows India's life expectancy at birth rose from 64.5 years in 2004 to 72.2 years in 2024 — a 7.7-year improvement in two decades. The trend is clear. An affluent retiree at 58–60 today, with access to quality healthcare, should plan for a 30–35 year retirement horizon as a prudent base case.
Inflation: The Indian Variable That Changes Everything
India's average CPI inflation ran at 6.64% annually from 2004–2024 versus just 2.40% for the US over the same period. That's nearly three times higher.
The 4% rule was calibrated for ~2–3% US inflation. At 6–7% Indian inflation, the rupee withdrawal amount grows much faster each year — compressing the corpus far more aggressively than US simulations suggest. A 1% difference in inflation assumption, sustained over 25 years, can shift your corpus adequacy dramatically.
Medical costs in urban India have risen sharply — and for retirees, healthcare spending tends to accelerate with age, making conservative inflation assumptions especially important.
Asset Allocation
Your portfolio mix directly affects what withdrawal rate is sustainable:
- Equity-heavy portfolios (60%+ equity) have historically generated higher long-term returns, supporting similar or slightly higher SWRs — but with significant short-term volatility
- Conservative portfolios (heavy debt and cash) reduce volatility but may not generate enough growth to sustain 30+ years of inflation-adjusted withdrawals
- For Indian investors, instruments like equity mutual funds, NPS, Senior Citizen Savings Scheme (SCSS, currently offering ~8.2% for Apr–Jun 2026), and PPF (~7.1%) serve very different roles in the portfolio
The right mix depends on your ability to tolerate drawdowns in the early retirement years — a factor that becomes critical when sequence of returns risk enters the picture.
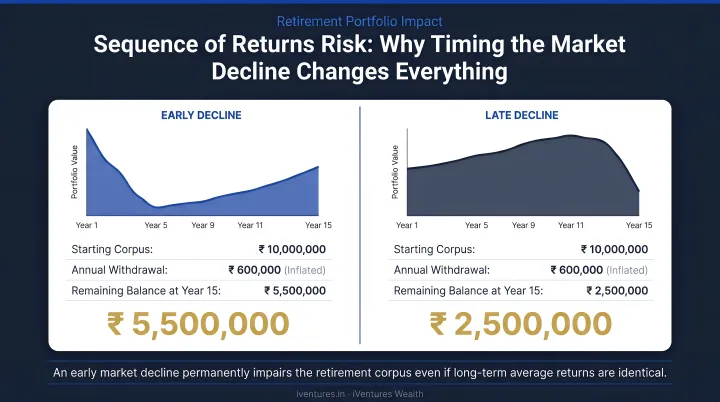
Sequence of Returns Risk
This is the most underappreciated retirement risk. A major market decline in Years 1–5 of retirement is far more damaging than the identical decline in Year 15.
Early losses combined with ongoing withdrawals erode the principal base that generates all future returns. The portfolio never fully recovers — even if markets eventually rebound.
A retiree who faced a 40% drawdown in Year 2 and one who faced the same drawdown in Year 18 can end up with dramatically different outcomes, even with identical average returns over 30 years. This is why the starting withdrawal rate matters so much, and why holding 5–7 years of expenses in stable, liquid assets at retirement significantly reduces this risk.
Other Income Sources
SWR applies only to your investable portfolio. Any income from EPF, NPS annuity, rental income, PPF maturity, or pension directly reduces how much you need to withdraw from the corpus.
Example: If your annual expenses are ₹18 lakh and you receive ₹6 lakh from SCSS interest and rental income, your portfolio only needs to fund ₹12 lakh — not ₹18 lakh. On a ₹3 crore corpus, that's a 4% required withdrawal rate rather than 6%. A meaningful difference for long-term sustainability.
Limitations of the 4% Rule for Indian Investors
The 4% rule was designed for a different market, a different inflation environment, and a different tax system. Applying it directly to an Indian portfolio creates four compounding problems:
1. Wrong data foundation. The rule is built on S&P 500 and US Treasury bond data. Indian equity markets have different return patterns, shorter formal market history, and different volatility characteristics. Research by Ravi Saraogi applying Bengen's methodology to Indian market data found a sustainable rate of 3.0% for an average Indian investor and 2.6% or below for risk-conservative investors.
2. Inflation mismatch. The 4% rule assumes roughly 2–3% annual inflation. India's CPI has averaged 6.64% over the past 20 years. The rupee withdrawal amount must grow faster each year, putting substantially greater strain on the corpus.
3. Spending pattern mismatch. The 4% rule assumes an identical inflation-adjusted withdrawal every year, regardless of markets or personal circumstances. Most retirees actually spend more in early retirement (travel, lifestyle, family) and less later. A fixed annual number forces spending into a shape that rarely matches how retirement actually unfolds.
4. Tax blindness. The 4% rule calculates gross withdrawals. In India, the tax treatment of withdrawals varies significantly:
- Equity mutual fund LTCG: 12.5% (post Budget 2024 rationalisation) above ₹1.25 lakh annually
- Debt/specified mutual funds acquired after April 1, 2023: gains taxed as short-term under Section 50AA
- SCSS interest: taxed at slab rates
- NPS annuity: taxed as income
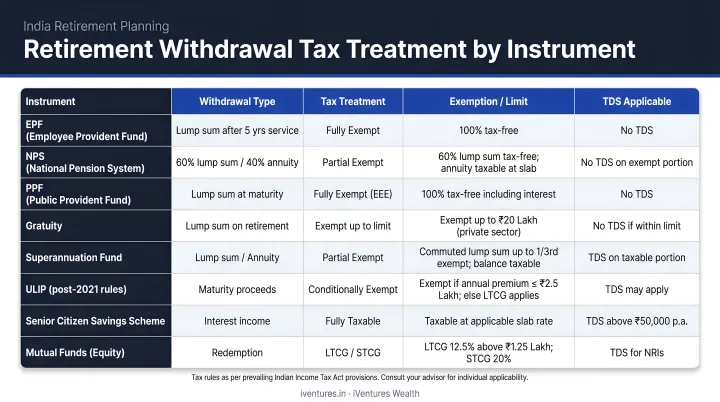
Your gross withdrawal rate must exceed your actual income need by enough to cover these taxes — which can add a meaningful percentage point or more to the headline rate you target.
Flexible Withdrawal Strategies Beyond the 4% Rule
Dynamic Withdrawal Approach
Instead of withdrawing a fixed inflation-adjusted amount every year, a dynamic strategy adjusts withdrawals based on portfolio performance. Strong markets allow slightly higher withdrawals; weak markets call for discretionary spending cuts.
The approach demands tracking and discipline — but it can extend your portfolio's lifespan well beyond what a rigid fixed strategy allows. It works best for retirees who have genuine flexibility in their discretionary spending.
The Guardrails Method
Developed through the Guyton-Klinger decision rules framework, the guardrails approach sets upper and lower boundaries:
- If your actual withdrawal rate drops below 3% of current portfolio value, you give yourself a raise
- If it rises above 5.5%, you cut discretionary spending
Research using this framework has shown initial withdrawal rates up to 5.8% under certain scenarios. That figure is conditional: it only holds if you actually make the spending adjustments when guardrails are triggered. It is not a higher SWR without strings attached.
Floor-and-Upside Approach
For affluent Indian retirees, this is often the most practical framework:
- Floor: Cover all essential expenses (housing, healthcare, food, utilities) with guaranteed income sources — NPS annuity, SCSS, PPF, rental income, pension
- Upside: Use portfolio withdrawals only for discretionary expenses (travel, lifestyle, gifting)
If your essential expenses are covered regardless of market conditions, market volatility becomes far less threatening. Your lifestyle floor is protected even in a severe downturn.
How to Build Your Personalised Withdrawal Plan
Step 1: Map Your Expenses
Separate your expenses into two categories:
- Essential: Non-negotiable fixed costs (healthcare, housing, food, utilities)
- Discretionary: Flexible spending (travel, dining, lifestyle upgrades, gifting)
Then identify which essential expenses can be covered by guaranteed income sources. The gap between guaranteed income and total expenses is what your portfolio must fund.
Step 2: Calculate and Stress-Test
Once you know your required annual portfolio withdrawal, calculate the implied withdrawal rate:
Required Withdrawal Rate = Annual Portfolio Withdrawal ÷ Total Corpus
Compare this against the sustainable benchmarks:
- Below 3%: Strong position — your corpus is likely well-sized
- 3%–4%: Reasonable, with appropriate asset allocation and flexibility
- Above 4%: Warrants attention — consider reducing planned expenses, building corpus further, or delaying retirement
If your required rate exceeds 4% and you have a 30+ year horizon, you have three levers: reduce planned expenses, grow the corpus before retiring, or delay the retirement date.
Step 3: Work With an Adviser Who Understands the Full Picture
For affluent investors with portfolios spanning equity funds, PMS, AIFs, bonds, and real estate-linked strategies, determining a personalised SWR requires more than a spreadsheet calculation. A comprehensive advisory process should cover:
- Mapping corpus across asset classes (equity funds, PMS, AIFs, bonds, real estate)
- Factoring in guaranteed income sources — EPF, NPS, SCSS, and rental income
- Accounting for post-tax withdrawal requirements at each life stage
- Structuring withdrawals around a three-bucket framework: safety, stability, and growth

iVentures Wealth's advisory team works through exactly this process with clients, incorporating pre-retirement glide-path planning to address sequence-of-returns risk — particularly relevant for early retirees with 30–35 year horizons.
Step 4: Review Annually
A withdrawal rate that works at 60 may need recalibration at 68. Annual reviews should assess:
- Portfolio performance relative to withdrawal pace
- Inflation trajectory versus original assumptions
- Changes in income from other sources
- Major new expenses (healthcare, family support)
- Tax law changes affecting net withdrawal amounts
Significant life events — a health change, a large unexpected expense, a market correction exceeding 20% — warrant an immediate out-of-cycle review, not waiting for the next annual check-in.
Frequently Asked Questions
What is the safe withdrawal rate for retirement planning?
The SWR is the percentage of your retirement corpus you can withdraw annually — typically 3%–4% for a 30-year horizon — adjusted upward by inflation each year, with a high probability your savings will last your lifetime. For Indian retirees, research suggests the lower end of that range is more appropriate given higher domestic inflation.
Is the 4% rule applicable for Indian retirees?
Not directly. The 4% rule was developed using US market data and assumes ~2–3% annual inflation. India's historical CPI has averaged 6.64%, and India-specific research points to a more sustainable rate of 3.0% or lower for Indian investors, making a personalised calculation essential.
How does inflation affect my safe withdrawal rate?
Higher inflation means your rupee withdrawal amount must grow faster each year, placing greater stress on the portfolio. At India's historical inflation rates, a corpus that looks adequate under US assumptions can come under real strain — particularly over horizons of 30 years or more.
What happens if I consistently withdraw more than my safe withdrawal rate?
Persistent over-withdrawal accelerates corpus depletion, and the damage compounds when it coincides with poor early market returns. The probability of running out of money before your planned end-date rises sharply, with little room to recover once the corpus is deeply eroded.
How often should I review my withdrawal rate in retirement?
At minimum, annually. You should also conduct an immediate review after major market corrections (20%+), significant health changes, large unplanned expenses, or material changes to other income sources. Conditions evolve; the plan must stay aligned with reality.
Does my asset allocation affect how much I can safely withdraw?
Yes. Portfolios with meaningful equity exposure have historically supported similar or slightly higher SWRs than all-debt portfolios over long horizons, because equity growth offsets inflation-adjusted withdrawals more effectively over time. The trade-off is greater short-term volatility, so the right balance depends on both your return needs and your tolerance for drawdowns.