But "expected returns from AIFs" is a phrase that deserves scrutiny. Returns vary sharply across categories, strategies, and fund managers. More critically, reported returns and actual cash received are two very different things — a distinction many investors miss until it's too late.
This guide breaks down what you can realistically expect across all three AIF categories, how returns are actually measured, and what factors determine whether a fund delivers on its headline numbers.
Key Takeaways
- AIFs span three SEBI categories, each with a distinct risk level, return profile, and liquidity structure.
- Returns are measured using IRR, MOIC, and DPI — understanding all three together gives you the complete picture.
- Category II private credit AIFs offer the most predictable cash returns; Category I VC and early-stage Category III carry higher upside but wider dispersion.
- A high headline IRR does not mean equivalent cash in hand — much reported alpha remains unrealised until exits are complete.
- Fund manager quality, lock-in period, and entry timing all materially affect actual outcomes.
What to Expect from AIF Returns: A Category-Wise Breakdown
SEBI classifies all AIFs into three categories, and each follows a distinct investment mandate. The return ranges below are indicative, not guaranteed, and actual outcomes depend heavily on fund manager skill, market conditions, and exit environment.
Category I: Venture Capital and Early-Stage Funds
Category I AIFs invest in startups, early-stage ventures, SMEs, social ventures, and infrastructure projects. The upside is significant when portfolio companies scale, but high failure rates among early bets create wide performance dispersion across funds.
NSE Indices benchmark data puts this in context: Category I vintage 2019 schemes reported a pooled IRR of 41.59%, with a TVPI of 2.59x but a DPI of just 0.05, meaning almost no cash had been distributed at that measurement point.
Vintage 2017 schemes showed a TVPI of 3.81x. Both figures illustrate the upside potential and the long timeline before actual cash distributions materialise.
Key characteristics:
- Fund tenure typically runs 8–10 years; meaningful distributions are rare before year 4
- Top-quartile funds significantly outperform the median
- High binary risk — a few winners often drive all the gains (classic power law)
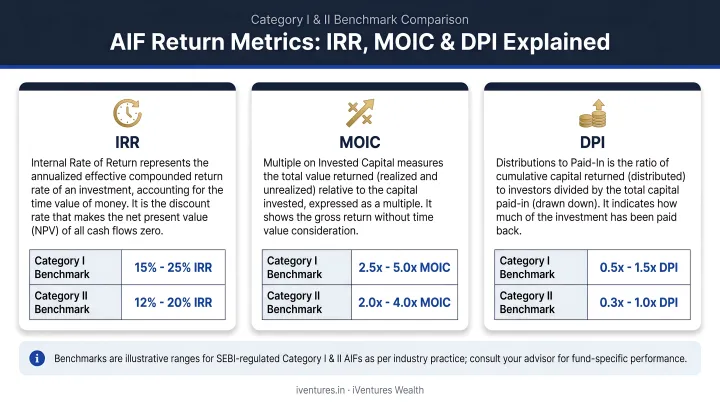
- Indicative IRR expectations: 15–25%+ for VC strategies in strong vintage years
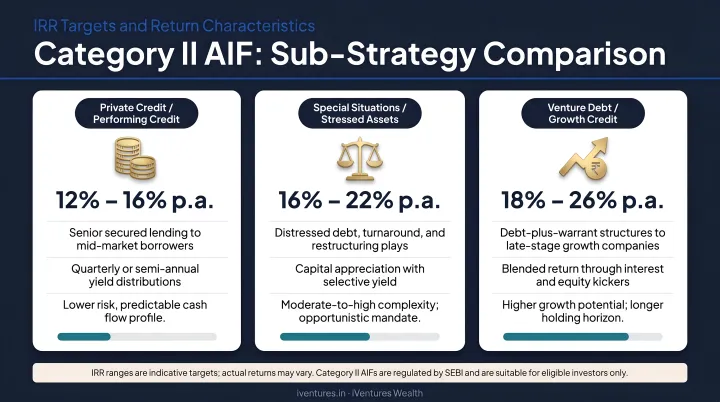
Category II: Private Equity, Private Credit, and Real Estate Funds
Category II is the largest AIF category in India, representing approximately 74% of total AIF commitments (₹11,64,118 crore of ₹15,74,050 crore as of December 2025). It spans three distinct sub-strategies:
| Sub-Strategy | Indicative Target IRR | Return Character |
|---|---|---|
| Private Equity (unlisted buyouts) | 18–25%+ | High growth, illiquid, exit-dependent |
| Private Credit / Structured Debt | 14–18% | Yield-like, more predictable, regular cash flows |
| Real Estate Structured Funds | 14–18% | Secured, structured, project-linked |
NSE benchmarks show Category II vintage 2019 schemes delivered a pooled IRR of 23.64% with a TVPI of 1.56x and a DPI of 0.41 — far more cash returned than Category I at the same vintage, reflecting the more regular cash flows from debt-oriented strategies.
For private credit specifically, EY's H2 2024 India Private Credit Report cites performing credit funds targeting 14–18% IRR, with realised exit IRRs ranging from 17–25% among established managers in that period.
For HNIs seeking inflation-beating income without equity-level risk, private credit AIFs occupy a useful middle ground. iVentures Wealth advises on this segment specifically, focusing on senior secured structures that target 12–16% IRR with quarterly cash flows as an alternative to fixed deposits.
Category III: Hedge Fund and Quant Strategies
Category III AIFs use complex strategies: long-short equity, quantitative/algorithmic funds, multi-strategy approaches, and PIPE (Private Investment in Public Equity). These funds can invest in both listed and unlisted securities and may use leverage.
NSE benchmark data breaks down the 3-year trailing returns by sub-category:
- Long Only Equity: 27.91% (3-year), 9.45% (2-year)
- Long Short Equity: 16.46% (3-year), 10.12% (2-year)
- Multi-Asset: 9.31% (3-year), 5.35% (2-year)
- Category III overall: 23.30% (3-year) — trailing the Nifty 50 TR at 27.80% over the same period
Unlike Category I and II, many Category III structures are open-ended, offering more liquidity. This makes them a different kind of AIF, closer in some ways to a PMS or hedge fund than to the illiquid closed-ended structures investors typically associate with private markets.
Understanding How AIF Returns Are Actually Measured
Many investors fixate on headline IRR without understanding what it represents, or how much of that return has actually landed in cash. This gap between perceived and actual returns is the single most common source of disappointment in AIF investing.
IRR (Internal Rate of Return)
IRR is the industry standard for closed-ended funds. It accounts for the timing of cash flows, not just the final gain, so a fund that returns capital faster shows a higher IRR even if the total value created is similar.
The problem: IRR can be inflated in early fund years by paper markups of unrealised holdings. A fund with a strong IRR in year 3 may show significantly lower returns by year 8 after actual exits.
MOIC (Multiple on Invested Capital)
MOIC shows total value generated per rupee invested. A 2x MOIC means ₹2 returned for every ₹1 invested. But MOIC ignores time — a 3x MOIC over 5 years versus 10 years represents a very different return outcome.
DPI (Distributions to Paid-In Capital)
DPI is the most investor-relevant metric. It measures actual cash received per rupee invested, stripping out unrealised valuations entirely.
The NSE benchmark data makes this contrast vivid:
- Category I, vintage 2019: DPI of 0.05 (almost no cash distributed), RVPI of 2.54 (most value still on paper)
- Category II, vintage 2019: DPI of 0.41 (meaningful cash returned), RVPI of 1.14
Private credit AIFs consistently score highest on DPI due to their regular coupon/interest payment structures — which is why they appeal to income-focused HNI investors.
Used together, these three metrics give a more complete picture of fund performance. To evaluate an AIF properly, look at all three:
- IRR — pace and efficiency of returns
- MOIC/TVPI — total value creation
- DPI — what has actually been paid out as cash
Factors That Influence AIF Returns
Fund Manager Quality
In private markets, manager selection matters more than asset class selection. McKinsey's research on private equity confirms that the performance gap between top- and bottom-quartile private equity managers is wider than in virtually any other asset class.
The exit track record matters more than the investment track record. Finding deals is the easy part; converting them to cash is what separates top managers from the rest. IPOs, secondary sales, and M&A transactions are what turn paper gains into realized returns. A manager with 50 investments and 3 exits tells a very different story from one with 30 investments and 20 clean exits.
iVentures Wealth's CFA-led research team evaluates GP track records, vintage comparisons, and fee structures independently of fund marketing materials as part of its AIF due diligence process.
Strategy and Market Cycle
AIF returns are not static across market conditions:
- Private equity depends heavily on entry valuations and exit windows (IPO markets, secondary buyers). India's PE-VC exit value rose 15% to approximately $29 billion in 2023, driven substantially by block trades in public markets.
- Private credit performs more consistently but is sensitive to interest rate cycles and borrower credit quality.
- Category III hedge-style funds can perform in both bull and bear environments but are affected by volatility regimes.
Lock-In Period and Capital Commitment
Most Category I and II AIFs carry lock-ins of 5–10 years, with SEBI permitting extensions of up to two years with consent from two-thirds of unit holders by value. Category III can offer more liquidity in open-ended structures.
The practical implication: capital committed to a Category I or II AIF should be money that won't be needed for a decade. Advisors typically recommend allocating 10–25% of an HNI's total portfolio to illiquid alternatives, enough to meaningfully impact returns without creating a liquidity trap.
Diversification Within the Fund
A Category I VC fund concentrated in 8 companies carries far more binary risk than one spread across 20 bets. The power law of VC returns — where typically 1–2 investments generate most of the fund's gains — means fund-level diversification and deal access both shape outcomes significantly.
AIF Returns vs. Mutual Fund Returns: What Is the Real Difference?
This comparison is not apples-to-apples. AIFs and mutual funds serve different purposes in a portfolio.
| Factor | Mutual Funds | AIFs |
|---|---|---|
| Minimum Investment | ₹500 SIP | ₹1 crore (SEBI mandated) |
| Liquidity | High (daily / T+3) | Low for Cat I/II; varies for Cat III |
| Strategy Access | Listed, liquid markets | Private, unlisted, or complex |
| Regulatory Framework | SEBI MF Regulations | SEBI AIF Regulations 2012 |
| Return Potential | Market-linked | Higher target, wider dispersion |
| Fees | 0.5–2% TER | 1–2.5% management + 10–20% performance fee |
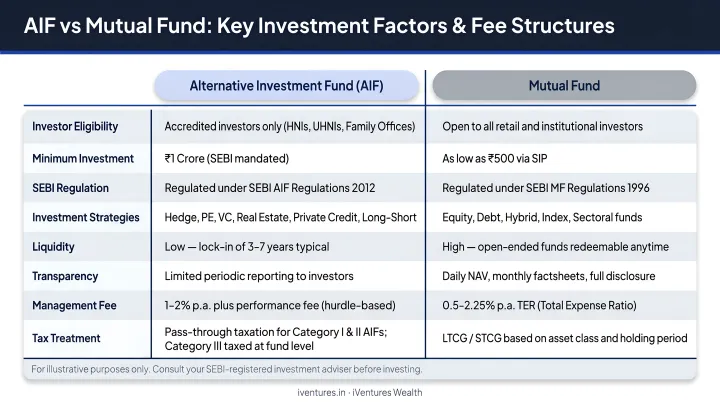
The fee gap deserves attention. AIF managers charge both a management fee and a performance/carry fee, which can noticeably reduce net returns compared to what marketing materials show. A fund targeting 20% gross IRR after a 2% management fee and 20% carry on gains above a hurdle will net somewhere in the 14–16% range for the investor. Still attractive — but very different from the headline number.
Some Category III long-only equity AIFs resemble concentrated mutual funds in strategy but are not inherently superior. Outperformance is not guaranteed, and the higher fee drag must justify itself through genuinely differentiated returns.
That context shapes how advisors typically position AIFs: as a complement to mutual funds, not a replacement. Most frameworks suggest allocating 10–25% of a UHNI portfolio to AIFs, with each category serving a distinct role:
- Category I — builds early-stage and growth equity exposure
- Category II (especially private credit) — anchors the fixed income and income layer
- Category III — adds tactical alpha through active or long-short strategies
Realistic Distribution Timelines: When Does the Money Come Back?
AIF returns are largely back-ended. The fund deploys capital over 2–3 years, builds positions, and exits over the remaining tenure. Investors should calibrate expectations accordingly:
- Early-stage VC (Category I): Distributions typically begin after year 4, continuing through year 10. The NSE data showing a DPI of 0.05 for 2019-vintage Category I funds (measured in 2024) reflects exactly this dynamic.
- Mid-stage PE funds (Category II): Distributions may start from year 3 onward as exits are realised.
- Private credit AIFs: The exception to back-loading. These function closer to fixed income — quarterly interest/coupon payments begin early, with principal returned at debt maturity, making them the most predictable cash flow structure among all AIF types.
These timelines, however, assume the fund exits on schedule — which isn't always the case. SEBI's regulations allow Category I and II AIFs to extend tenure by up to two years with unit holder approval, and some funds do use that runway. Before committing capital, review the extension provisions in the fund's PPM carefully and plan around a range of outcomes, not just the stated termination date.
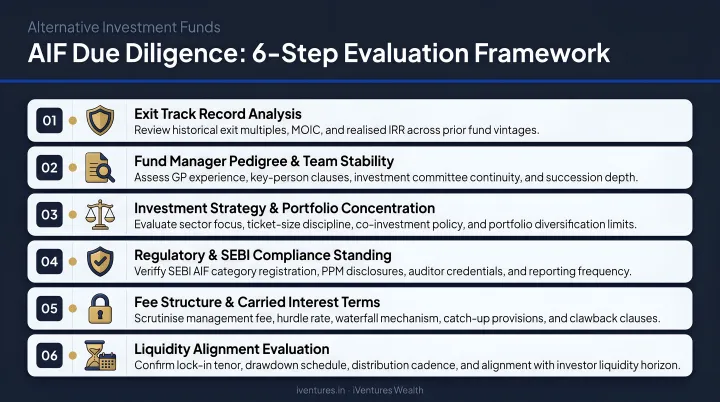
How to Evaluate an AIF Before Investing
Most investors read the fund presentation and stop there. That's not enough — especially when the minimum ticket is ₹1 crore and the lock-in may extend a decade.
Core due diligence checklist:
- Exit track record — How many investments has the manager exited, via what routes (IPO, M&A, secondary), and at what realised IRRs? Investments made ≠ value created.
- DPI across prior vintages — What proportion of capital has actually been returned as cash in earlier funds?
- Quartile performance — Where does the fund rank against the NSE AIF benchmark for its category and vintage?
- Fee structure — What is the management fee, hurdle rate, and carry percentage? Model the net-to-investor return after fees.
- Governance and reporting — Does the manager provide transparent quarterly reporting? Are valuations independently assessed?
- Liquidity alignment — Does the fund's lock-in and distribution profile match your actual cash flow needs over the next 7–10 years?
Running through each of these criteria independently is where most individual investors hit a wall. iVentures Wealth, a SEBI-registered investment adviser (INA000019026), conducts structured AIF evaluation for UHNI and family office clients — covering fund manager track records, vintage comparisons, fee modelling, and GP exit history.
Their CFA-led research team produces a fund-specific assessment that translates into clear, comparable conclusions: which managers have actually returned capital, at what IRRs, and whether the risk-adjusted outcome justifies the illiquidity premium being asked.
Frequently Asked Questions
Are AIF returns better than mutual fund returns?
AIFs target higher returns through access to private markets and specialised strategies unavailable through standard funds. The trade-off is higher risk, longer lock-ins, and no liquidity guarantee. Most investors use AIFs alongside mutual funds rather than instead of them.
Can AIFs provide 25% returns on investment?
Top-performing Category I VC and Category III funds in strong market cycles have delivered returns in this range, but such outcomes are not typical or guaranteed. Median returns across categories are meaningfully lower, and past performance does not predict future results.
Which AIFs in India have the best returns?
Performance varies significantly by category, strategy, and vintage year. Top-quartile Category II and III funds have demonstrated strong track records, but selection requires evaluating DPI, IRR, exit history, and consistency across vintages — not just one-year headline numbers.
What is the minimum investment required for an AIF in India?
SEBI mandates a minimum of ₹1 crore per investor for most AIFs. The minimum is ₹25 lakh for employees or directors of the AIF or its manager, and for angel fund investors.
How long do you need to stay invested in an AIF?
Category I and II AIFs typically lock in capital for 5–10 years, with possible extensions of up to two years. Category III open-ended structures offer more flexibility, while private credit AIFs return capital more predictably through regular coupon distributions.
Are AIF returns guaranteed?
No. AIF returns depend on market conditions, fund manager skill, the performance of underlying portfolio companies, and exit conditions. Investors should only commit capital they can afford to keep locked in without straining their overall financial plan.