Since the past few weeks, everyone is concerned with what is happening across the globe. The global pandemic has raised health, economic, and financial issues worldwide and enhanced unpredictability. Talking in term of finance, such problematic events in the our industry are labeled as ‘Black Swan Events’ and they raise concern related to the portfolio performance of investors. Many of investors reached out to our us for understanding what could be the worst case scenarios when it comes to their portfolios?
Therefore, we share our thoughts on some comparison of different asset allocation portfolios and how things look on a relative basis. Let us understand that with the help of a few factual scenarios:
50:50 portfolio mixtures of Sensex and government bonds
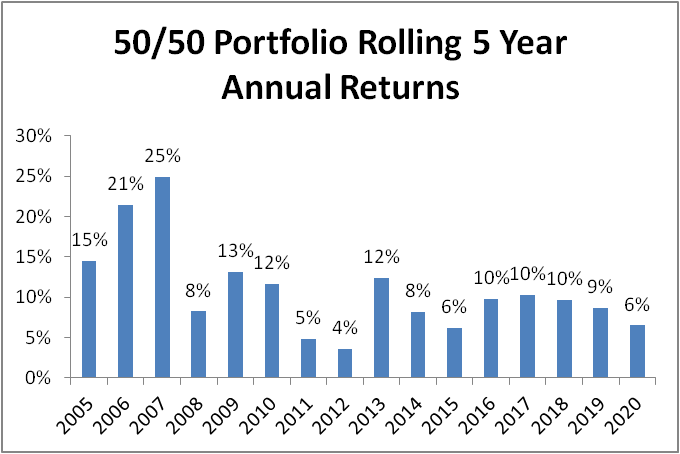
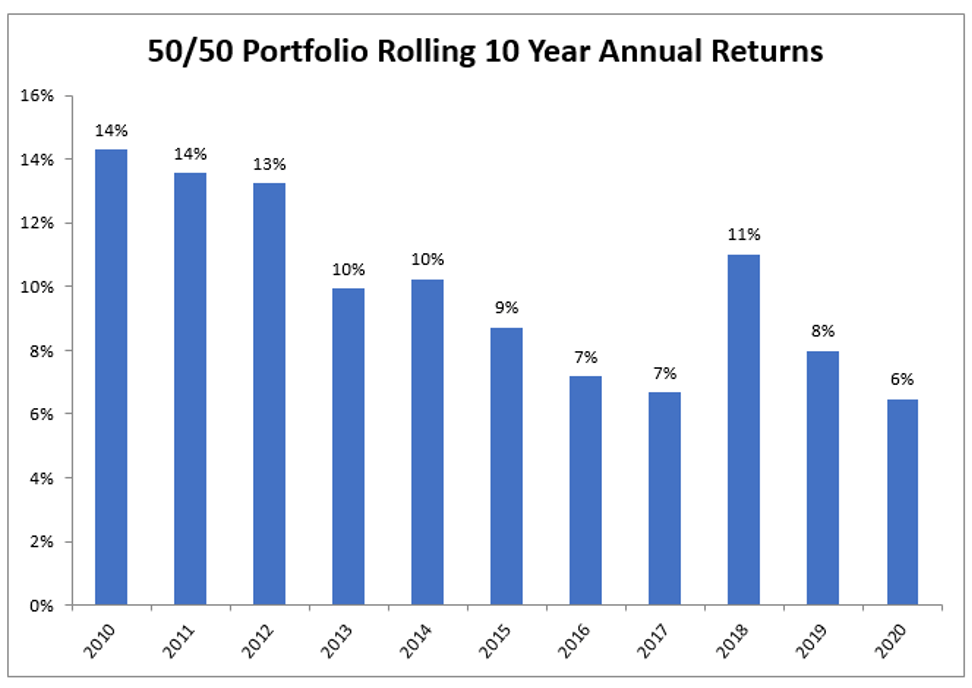
This chart above shows that if an investor invested in 50/50 asset allocation portfolio in any year in between 2000 to 2015 and held it for the next 5 and 10 years, there was never a negative return in any 5 year rolling periods.
In 2007, if someone had invested and held it for the next 5 years (which included subprime mortgage crisis in 2008), their worst case scenario on the basis of 5 years annual rolling return was 4% in 2012.
75:25 portfolio mixtures of Sensex and government bonds
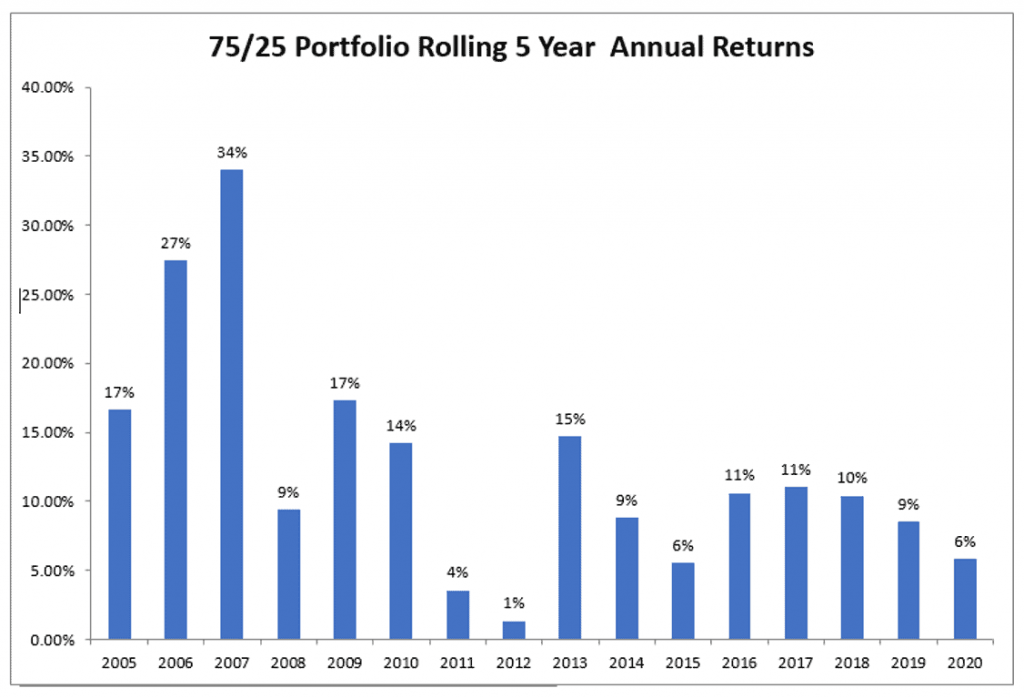
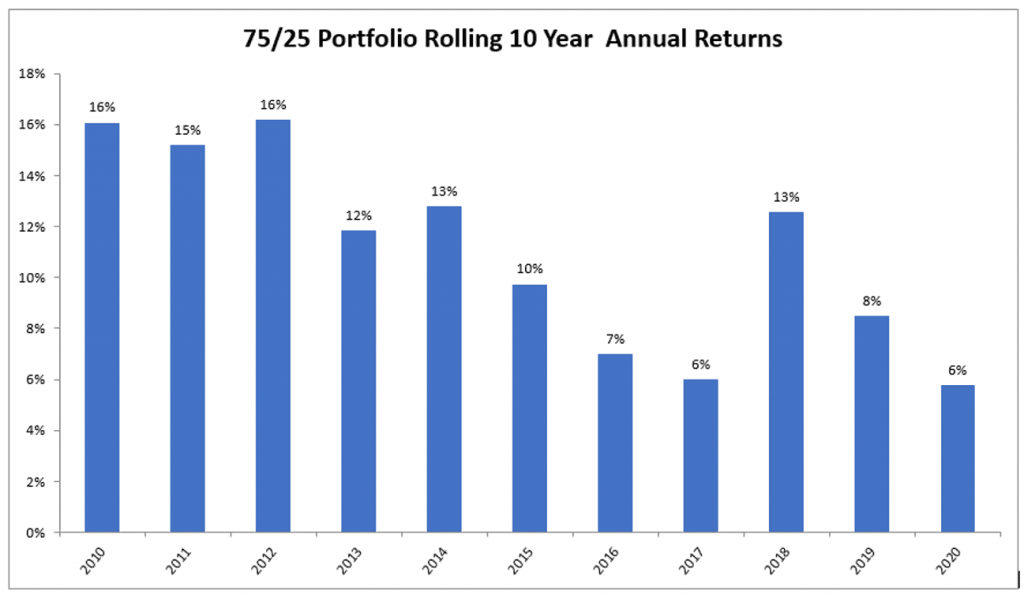
The 75/25 portfolio of Sensex and Government bonds too never experienced a negative return. It had delivered at-least 1% return in worst case scenario over 5 year rolling returns period but in the 10 year chart the median return are positively greater than FD’s with 64% (approx.) probability of getting returns in double digits.
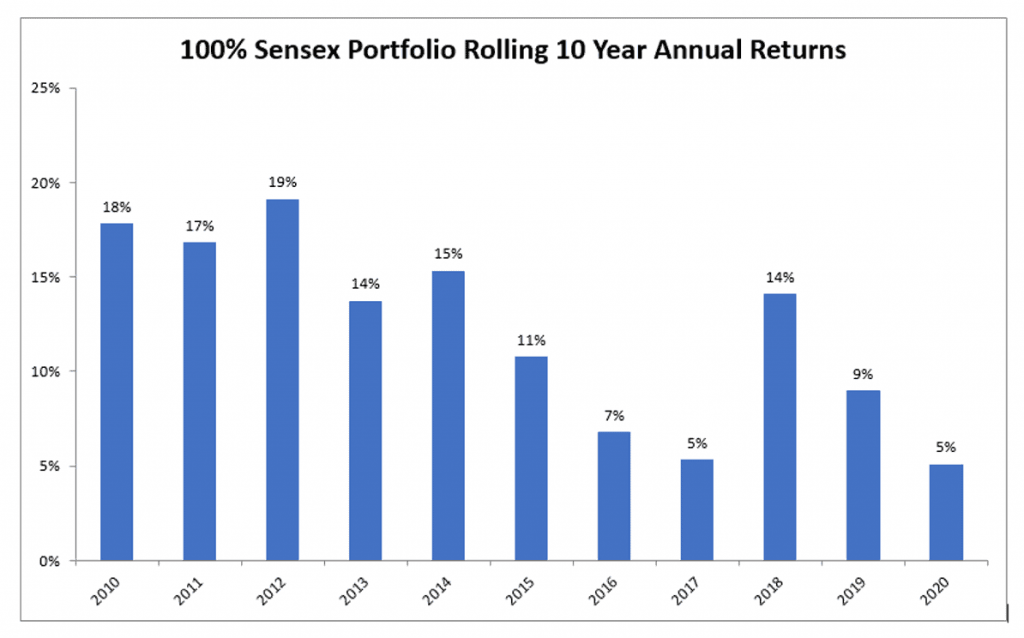
100% portfolio of Sensex
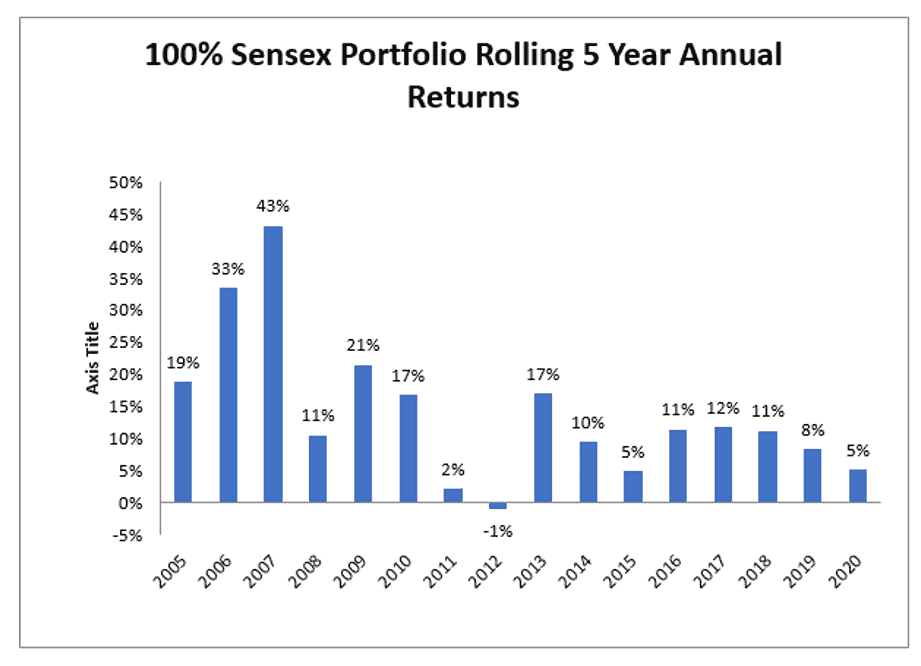
This chart shows that since 2000, the Sensex has seen positive returns approx. 93.8% of the time for all 5 year rolling periods. That means only 6.2% of the time returns were negative over a 5 year rolling period.
If one held their 100% Sensex investment, rolling 10 year annual returns were never negative and had delivered at-least 5% return in worst case scenario.
Summarizing the Scenarios:
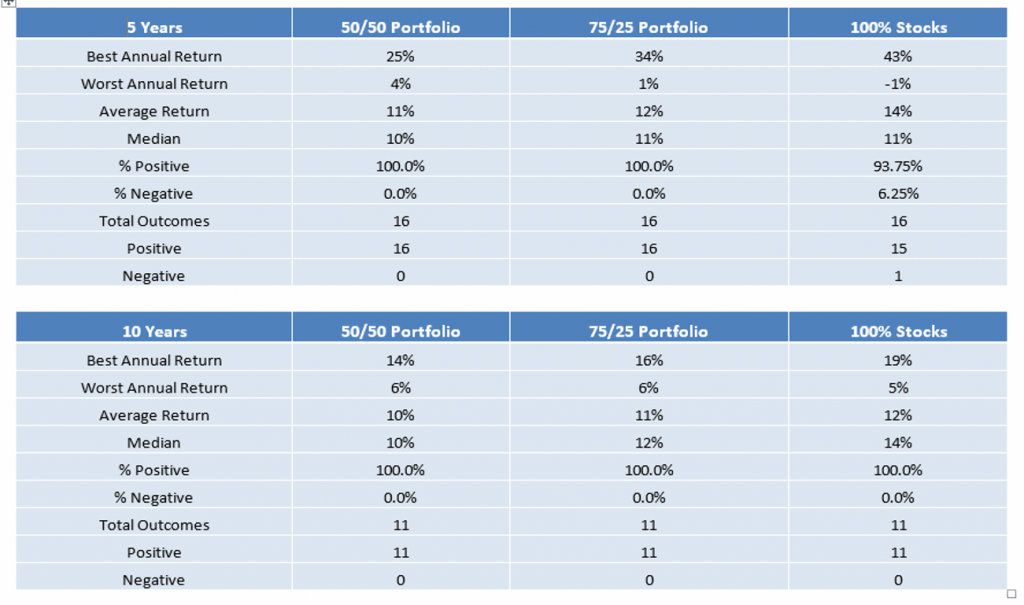
The table summarizes the learning that equity investing is an long term affair and one will face ups and downs during the journey which is the inherent nature of the markets. But if one completes the journey/cycle of 5/10 yrs there is a high probability of handsomely beating FD’s as the averages suggest in both cases.
It also highlights how adding debt to the portfolio through bonds can reduce the interim volatility and not hurt the overall returns drastically as the average return in the scenarios hover between 11-14% over 5 yrs and 10-12% over 10 yrs.
So don’t let short term volatility wither you on achieving the long term goal.
What are rolling returns?
Rolling returns, also known as “rolling period returns” or “rolling time periods,” are annualized average returns for a period, ending with the listed year. Rolling returns are useful for examining the behavior of returns for holding periods, similar to those actually experienced by investors. (Source: Investopedia)
Several people pointed out the fact that bond yields are now much lower than they were historically. This is true. Investors cannot expect the bond side of their portfolio to add much to the reward side of the equation from current levels.
Bonds have always been more of a risk-reducer. It’s just that in the past, that reduction in risk came with much better yields.
However, to conclude it all, this doesn’t change the risk-reward relationship going forward. If you want to earn higher returns, you have to be willing to accept more volatility and higher losses. And if you want to see less volatility and shall lower losses, you will have to accept lower returns.

Author – Kashiv Chawla
Executive, iVentures Capital
Data: All Annual rolling returns are calculated on 31st March closing data price basis.
Data Source: 5 year Govt. bond data: https://in.investing.com/rates-bonds/india-5-year-bond-yield-historical-data,
10 year Govt. bond data: https://in.investing.com/rates-bonds/india-10-year-bond-yield-historical-data,
Sensex Data: https://www.bseindia.com/Indices/IndexArchiveData.html.
Source: https://awealthofcommonsense.com/2020/04/more-thoughts-on-the-worst-case-scenarios-for-diversified-portfolios/